Tax Day Again

As we end the 2018 tax preparation season, it is important that we review some of the components of the new tax laws that were enacted at the end of 2017.

One of the more significant items is the elimination of the potential for deductibility for investment advisory fees. This would also include fees paid to your tax preparer as well as other miscellaneous itemized deductions. A significant amount of our planning involved trying to position fees so that they were potentially deductible. If you have a situation where you have a taxable account along with an IRA account, we often times would charge the fee for the IRA account to the taxable account in addition to the taxable account’s own fee, therefore making both fees potentially tax deductible. Going forward an IRA should pay its own fee; it is not as beneficial as a current deduction like you could have potentially achieved under the old law, but at least doing it that way gives you a future tax deduction.

The $10,000 limit on state and local taxes also has a number of implications. Many people who formerly itemized will no longer be able to do so because the standard deduction for married couples has gone up to $24,000. If you’re limited to $10,000 in deductible state taxes you need to come up with $14,000 in other itemized deductions such as charitable contributions or perhaps medical expenses in order to be able to itemize. We expect the number of taxpayers who are going to be itemizing will be down significantly; many may find they are able to prepare their own tax returns going forward.

The changes to the Alternative Minimum Tax (AMT) are also significant. The AMT is a parallel tax structure with its own set of rules. It disallows certain tax deductions when calculating a minimum amount of tax that you need to pay – such as state and local tax deductions and dependent exemptions. Many investors found themselves paying AMT because of their state tax deductions. Now with that limited to $10,000, it will affect a much smaller number of taxpayers. Moreover, the AMT exemption amounts increase to $70,300 for single filers and $109,400 for joint filers and the income phase out for those taxpayers increases to $500,000 and $1 million, respectively. Not only did they increase the exemption, but they increased the income at which the exemption would phase out, knocking out another large swath of taxpayers who will no longer be subject to the AMT.

The change in the corporate tax rate has been widely reported. This lower rate should result in a financial boom for corporations. It’s interesting to note that the U.S. corporate tax rate was among the highest in the developed world. The average corporate tax rate in the developed world is 22 percent and now the U.S. is at 21 percent. Being closer to the average tax rate should bode well for U.S.-based companies, allowing them to keep their operations and profits here in the U.S.

There is also an important change for business owners who use a pass-through tax entity to avoid double taxation on profits. Individuals who have an LLC or partnership may now take a 20 percent deduction on their pass-through business income subject to phase outs for those earning above $157,500 (single) and $315,000 (married, filing jointly). The 20 percent deduction is intended to put the tax load on pass-through entity income par with the reduced tax load for a C-corporation.

While things are different, the good news is that almost every taxpayer should see some reduction in their taxes. The additional spending that should generate in the economy should be very good for us.


Thomas W. Batterman is Principal and Fiduciary Advisor at Financial Fiduciaries, LLC. He can be reached at tbatterman@yourfiduciaries.com or 715-848-8110, ext. 302.

Posted in Financial Fiduciaries, Thomas Batterman, Tom Batterman | Leave a comment

Trade War?

The Trade War that Isn’t—Yet

When most of us hear talk about something described as a “war,” we intuitively recognize that there could be very unpleasant outcomes on all sides.  Wars have one thing in common: there is seldom a clear-cut “winner” amid the damage and destruction.

So when President Trump declares a “trade war” against the world’s second-largest economy, it’s natural that many people—including, apparently, a large number of investors—would feel spooked about what’s to come in our collective future.  This explains why every escalation of words, and new lists of things that will be taxed at U.S. and Chinese borders, has provoked sharp downturns in the markets.

But what, exactly, is a “trade war?”  Beyond that, what is a “trade deficit” and why are we trying to “cure” America’s trade deficit with China?

To take the latter issue first, every bilateral trade deficit is simply a calculation, made monthly by government economists, that adds up the value of products manufactured in, say, China that are purchased in, say, the U.S. (Chinese exports or U.S. imports), and subtracts the value of products manufactured in the U.S. that are purchased by Chinese consumers (U.S. exports or Chinese imports).  The first thing to understand is that this is not a very precise figure.  To take a simple example, Apple manufactures its iPhones in southern China, ship them to the U.S. for sale, and the value of each of the millions of smart phones is counted as a Chinese export to the U.S. market.  Apple reaps extraordinary profits, but this is considered a net negative in terms of U.S. trade.

Moreover, the full value of each iPhone is considered on the import ledger, without subtracting out the value of the “services” that Apple provides.  The software and design were, after all, created in the U.S., and are a large part of the value of the phones that people become so addicted to.  But these financially valuable aspects of the phone, made in America, are not reflected in the trade numbers.

Beyond that, many economists question whether a trade deficit is a bad thing in the first place.  Chances are, you run a significant trade deficit with your local grocery store; that is, it brings to your neighborhood the food you put on the table, and you exchange money for it.  You import food, but the grocery story doesn’t import a comparable amount of things you make in your garage.  Are you materially harmed by this economic opportunity that takes dollars out of your pocket and puts them in the hands of the grocery store?  If you were, you might take your business to the grocery store further up the road, and run a trade deficit with a different establishment.

How does this relate to the U.S./China trade relations?  Simple mathematics indicates that Chinese manufacturers are taking dollars from U.S. consumers, but they have to do something with those dollars to balance the ledger.  That money finds its way into purchases of U.S. debt (Treasury bonds) or reinvestment in the U.S. economy, buying real estate or investing in domestic companies.

You fight trade wars with tariffs, which are simply a government tax on specific items when they cross the border.  So when the Trump Administration announces the list of 1,300 different products that will become the targets of its tariff plan, that means that anyone buying those products will see their taxes go up—invisibly, in a higher cost of living.

The bigger potential damage comes when China retaliates in kind, and certain sectors of the U.S. economy have to pay the Chinese government a tariff for the privilege of selling their products to the Chinese market.  China represents 15-20 percent of Boeing’s commercial airline sales, so a proposed 25% tariff could sting.  More directly impacted are U.S. farmers.  Soybeans represent the largest agricultural export from the U.S. to China ($14.2 billion worth of shipments in 2016, about one-third of the U.S. crop), and the Chinese consume a lot of U.S.-raised pork.  When the tariffs were announced, pork futures dropped to a 16-month low, and soybean futures fell 5% overnight.

The larger concern is that China is preparing to shift its sourcing of agricultural products from the U.S. to Brazil and Argentina, and the retaliatory tariff makes this economically attractive for Chinese consumers.  Will that business ever come back again?

If this has you worried, or searching China’s latest list to see which stock might be impacted as the rhetorical trade war escalates, it might be helpful to take a step back.  So far, none of these tariffs have been levied; no actual shots have been fired in the trade war, which means it is not yet a “war” at all.  The U.S. and China are trading retaliatory lists of potential targets, and there is some escalation in the value and extent of those lists.  But when it comes time to actually fire those shots, the most likely scenario is a generous compromise that leaves us with the status quo.

Remember how worried the markets were when the Trump Administration abruptly announced new levies against global steel and aluminum imports?  It turned out to be mostly bluster.  A full 50% of all U.S. steel imports, from Brazil, South Korea, Mexico, Canada and others, were exempted from those tariffs.  Larry Kudlow, the White House’s new economic advisor, said several times last week that there would be, in fact, no new tariffs, and no trade war with China.  It will be months before any of the proposed tariffs could be put into place, which is plenty of time for Kudlow’s prediction to come true—and make all the panic sellers who drove down stock prices look a little bit silly.


Contributed by Bob Veres
Sources:

https://www.politico.com/magazine/story/2018/04/07/how-to-win-trade-war-…

http://www.slate.com/articles/business/the_edgy_optimist/2014/03/u_s_chi…

https://www.forbes.com/sites/timworstall/2016/12/16/apples-service-expor…

https://www.desmoinesregister.com/story/money/business/2018/04/06/future…

Posted in Uncategorized | Leave a comment

Medicare’s Future

Several items that everybody seems to be overlooking in the recent budget deal signed by President Trump are potentially-significant changes to how Medicare is administered. First on the list is the elimination of Medicare’s independent payment advisory board, authorized under the Affordable Care Act to serve as a check on higher Medicare expenses, labeled by some as a “death panel.”

Beyond that, there were changes to prescription drug coverage under Medicare’s Part D plans, which cover 42 million seniors. The so-called “donut hole,” the point where overall expenses are high enough that the patient suddenly starts paying for drugs out-of-pocket, but not (yet) above the threshold where more generous catastrophic coverage kicks in, was supposed to end in the year 2020. In that year, consumers would pay no more than 25% of the costs of their drugs, less in many cases. The budget deal will close the donut hole in 2019 instead.

In addition, people who require long-term outpatient therapy have had to deal with expense caps—but the budget deal removes them.

How will the government pay for these benefits? The new budget requires individuals earning more than $500,000 a year, or joint filers earning more than $750,000, to pay 85% of the actual costs of their Part B and D plans in 2019, up from 80% this year. (Most Medicare enrollees pay premiums that equal about 25% of these costs.)

Contributed by Bob Veres

Sources:

https://www.pbs.org/newshour/economy/making-sense/president-trump-signed-these-medicare-changes-into-law-heres-what-to-watch-for
https://www.pbs.org/newshour/nation/who-wins-and-who-loses-in-trumps-proposed-medicare-drug-plan

Posted in Uncategorized | Leave a comment

The Fed’s Minutes

Sunny Weather Forecast

Economists and traders pay a lot of attention to something that probably doesn’t keep you up at night: the FOMC Minutes, or, in English, the summary of the discussion among decision-makers on the Federal Reserve Board, known as the Federal Open Market Committee.

What do they discuss? The health of the U.S. economy, the prospects for inflation, and whether interest rates should be raised or lowered. The latter issue, of course, is the reason for all the fuss; traders want to know if rates are going to go up faster than people expect, which might slow down the economy and reduce demand for stocks.

Yesterday, the FOMC released the minutes from its late January meeting in Washington, DC, and the news was generally upbeat. FOMC members appear to believe that the U.S. economy has reached full employment and that the core inflation target will be met in a couple of years with no significant concern that it will overshoot that level. You can read the full report here: https://www.federalreserve.gov/monetarypolicy/files/fomcminutes20180131.pdf but some excerpts show how sunny is the forecast among these economic weathermen:

“Participants characterized their business contacts as generally upbeat about the economy; their contacts cited the recent tax cuts and notable improvements in the global economic outlook as positive factors. Manufacturers in a number of Districts had responded to increased orders by boosting production….”

“Businesses in a number of Districts reported plans to further increase investment in coming quarters in order to expand capacity….”

“Many participants reported that labor market conditions were tight in their Districts, evidenced by low unemployment rates, difficulties for employers in filling open positions or retaining workers, or some signs of upward pressure on wages…”

“Business contacts in a few Districts reported that they had begun to have some more ability to raise prices to cover higher input costs.”

Of course, the markets dove at the end of the following day, and one interpretation of the minutes is that the Fed will tighten rates faster and more often than had previously been reported. That would be a negative for stocks, but it’s also pure speculation; all the Fed decision-makers promised was “further gradual tightening,” which is ambiguous enough to fit anybody’s interpretation. The most balanced way to read the minutes is to take the Fed at its word: it sees a healthy local and global economy and a return to wage prosperity unfolding before its eyes. That doesn’t mean the market can’t go down and stay down, but it does suggest that the economic doomsayers don’t have a lot of fans at America’s central bank.


Contributed by Bob Veres

Posted in Uncategorized | Leave a comment

Uneven Inflation

Inflation Impact

We all know that inflation gradually erodes the value of our dollars, and you’re probably aware that this is one of the main reasons for investing in the stock market. If you hide your money safely under your mattress, it becomes incrementally less valuable each year depending on the inflation rate. To keep pace, you have to find ways to make it grow at least as fast as the value of a dollar is falling.

But you may not have heard about inflation as an argument against putting too much of your retirement money in a fixed annuity, which pays you a fixed amount for the rest of your life. That safe, comfortable income stream may work perfectly for you today, but will it be enough to live on 20 or 30 years in the future?

If you’re curious how much damage inflation can do to you over longer time periods, look at a free online calculator available here: https://www.calcxml.com/do/ret05. You can input your current age and the income you’re receiving, and the site will calculate what your future income would need to be at some point in the future, just to maintain your current lifestyle.

Let’s say you’re 65 today, receiving $100,000 a year from an annuity. How much of your future lifestyle will that annuity pay you when you’re 90?

Assuming an inflation rate of 3% a year, you would need $209,378 in that year you turn 90 to afford the same things you do today. So your other investments would have to contribute more, in that year, than what the annuity was paying you. Put another way, the annuity would be paying less than half of what you need to maintain your current expenses into the later years of your retirement. If inflation were to average 4%, the future income needed to match today’s $100,000 rises to $266,584.

This is not an argument that annuities are to be avoided in all cases; a guaranteed lifetime income may have its place in some financial plans. But a few inputs into this calculator can go a long way toward making the case that investments that grow over time are vitally necessary to afford a comfortable future retirement. The safety of a guaranteed fixed income is a false promise, because it doesn’t protect you against the near-certain, incremental danger of yearly inflation.

CA – 2018-2-21 – uneven Inflation

Contributed by Bob Veres

Posted in Uncategorized | Leave a comment

Perspective on Recent Market Events

Perspective on Today’s Market EventsPerspective on Recent Market Events
It looks like the U.S. stock market will finally get something that happens, on average, about once a year: a 10+% percent drop—the definition of a market correction.  The last time this happened was a whopper—the Great Recession drop that caused U.S. stocks to drop more than 50%–so most people today probably think corrections are catastrophic.  They aren’t.  More typically, they last anywhere from 20 trading days (the 1997 correction, down 10.8%) to 104 days (the 2002-2003 correction, down 14.7%).  Corrections are unnerving, but they’re a healthy part of the economy—for a couple of reasons.

Reason #1: Because corrections happen so frequently and are so unnerving to the average investor, they “force” the stock market to be more generous than alternative investments.  People buy stocks at earnings multiples which are designed to generate average future returns considerably higher than, say, cash or municipal bonds—and investors require that “risk premium” (which is what economists call it) to get on that ride.  If you’re going to take more risk, you should expect at least the opportunity to get considerably more reward.

Reason #2: The stock market roller coaster is too unsettling for some investors, who sell when they experience a market lurch.  This gives long-term investors a valuable—and frequent—opportunity to buy stocks on sale.  That, in turn, lowers the average cost of the stocks in your portfolio, which can be a boost to your long-term returns.

The current market downturn relates directly to the first reason, where you can see that bonds and stocks are always competing with each other.  Monday’s 4.1% decline in the S&P 500 coincided with an equally-remarkable rise in the yields on U.S. Treasury bonds.  Treasuries with a 10-year maturity are now providing yields of 2.85%–hardly generous, but well above the record lows that investors were getting just 18 months ago.  People who believe they can get a decent, relatively risk-free return from bond investments are tempted to abandon the bumpy ride provided by stocks for a smoother course that involves clipping coupons.  Bond rates go up and the very delicate supply/demand balance shifts, at least temporarily, in their direction, and you have the recipe for a stock market correction.

This provides us all with the opportunity to do an interesting exercise.  It’s possible that the markets will drop further—perhaps even, as we saw during the Great Recession, much further.  Or, as is more often the case, they may rebound after giving us a correction that stops short of a 20% downturn.  The rebound could happen as early as tomorrow or some weeks or months from now as the correction plays out. Once it’s over, no matter how long or hard the fall, you will hear people say that they predicted the extent of the drop.

So now is a good time to ask yourself: do I know what’s going to happen tomorrow?  Or next week?  Or next month?  Is this a good time to buy or sell?  Does anybody seem to have a handle on what’s going to happen in the future? Record your prediction, and any predictions you happen to run across and pull them out a month or two from now.  Chances are, you’re like the rest of us.  Whatever happens, will come as a surprise, and then look blindingly obvious in hindsight.  All we know is what has happened in the past.  Today’s market drop is nothing more than a data point on a chart that doesn’t, alas, extend into the future.

Contributed by Bob Veres

Sources:
https://www.fool.com/knowledge-center/6-things-you-should-know-about-a-stock-market-corr.aspx

Click to access sp500corrbear.pdf

https://finance.yahoo.com/news/stocks-getting-smashed-143950261.html

Posted in Uncategorized | Leave a comment

Retirement gender differences


You may have read that women are far more likely to face poverty in retirement than their male counterparts—but you may not realize just how big the disparity is.  In fact, women are 80% more likely to fall into poverty toward the end of their lives, compared to men, according to a 2016 study by the National Institute on Retirement Security.

In an attempt to explain how this came about, the study’s researchers noted that women are more likely than men to engage in part-time unemployment due to starting a family and staying at home with the kids, and at the other end of their lives, they have much higher rates of caregiving for elderly parents.  Men, on the other hand, can enjoy an uninterrupted work career, making them more likely to receive promotions and career opportunities.

Even if you take away this disadvantage, there’s another one.  During their working years, women earn, on average, 80 cents for every dollar their male colleagues earn—for the same jobs.

But…. Isn’t this changing as we become a more gender-aware society?  Apparently not.  If you look at the accompanying chart, you’ll see that women were catching up to male pay scales from 1979 until about 1993, at which point the gains seemed to totally stall out.  And women still make up 66% of all caregivers for elderly parents.  Even when men provide assistance, the Family Caregivers Council estimates that women spend as much as 50% more time than the men do in caregiving activities.


And 2015 data adds that 48% of women above age 75 live alone, compared with less than a quarter (22%) of men at a comparable age.  After caregiving for others, women are less likely to receive it for themselves.

Contributed by Bob Veres

Sources:

https://www.bls.gov/opub/reports/womens-earnings/2016/home.htm

https://www.caregiver.org/women-and-caregiving-facts-and-figures

https://www.forbes.com/sites/karastiles/2017/11/01/heres-how-the-gender-gap-applies-to-retirement/#6d84cafd6519

Posted in Uncategorized | Leave a comment

Strategies for Claiming Social Security

Claiming social security benefits is more than a rite of passage for the retiree.   It is actually one step in an overall strategy, that if not calculated into the entire retirement resource strategy, you may be leaving money on the table.

According to the Social Security Administration, Social Security benefits account for at least half of income for 50% of married couples (married couples should coordinate their claiming strategy) and 71% of unmarried individuals.  For 23 percent of married couples and 43 percent of unmarried individuals, those benefits represent 90 percent or more of income.

It’s important to factor this stream of income along with other income “buckets” that you may have in place.  Working with your financial advisor is beneficial.   It may be that social security is in fact one of the last spicket that you turn on as an income source in retirement in order to map out your best your most optimal claiming strategy.

The Social Security Administration would previously mail out statements however that is no longer the case.  You may obtain a statement by visiting www.ssa.gov.

They say that timing is everything and nothing could be more accurate when it comes to the necessary steps for claiming your social security benefit.  The Social Security Administration establishes a guideline that suggests that seniors not rely on Social Security benefits to replace more than 40% of their working wages come retirement, but in many instances, we are discovering that seniors and pre-retirees are paying little heed to this advice.

There’s an acronym worth memorizing when the subject of Social Security arises.   It is Full Retirement Age or FRA.  Your FRA is determined by the year in which you were born and when you are able to receive 100% of your Social Security benefit.  For those born between 1943 and 1954, your FRA is 66 years of age.   Each additional year one waits to draw on social security between the age of 62 and 70 translates to roughly 8% growth in monthly benefits.  Note the chart below.

Social Security Graph
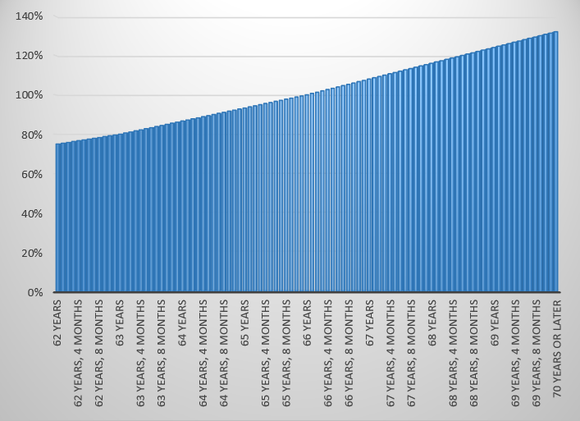
THE SOCIAL SECURITY RETIREMENT BENEFIT SCHEDULE FOR PEOPLE BORN BETWEEN 1943 AND 1954. CHART BY AUTHOR. DATA SOURCE: SOCIAL SECURITY ADMINISTRATION.

This important component to your retirement planning needs careful consideration.   Please feel free to contact us with any questions you may have.  We look forward to continuing the discussion with you.

Posted in Uncategorized | Leave a comment

Investments need to outpace inflation


Inflation Impact

We all know that inflation gradually erodes the value of our dollars, and you’re probably aware that this is one of the main reasons for investing in the stock market.  If you hide your money safely under your mattress, it becomes incrementally less valuable each year depending on the inflation rate.  To keep pace, you have to find ways to make it grow at least as fast as the value of a dollar is falling.

But you may not have heard about inflation as an argument against putting too much of your retirement money in a fixed annuity, which pays you a fixed amount for the rest of your life.  That safe, comfortable income stream may work perfectly for you today, but will it be enough to live on 20 or 30 years in the future?

If you’re curious how much damage inflation can do to you over longer time periods, look at a free online calculator available here: https://www.calcxml.com/do/ret05.  You can input your current age and the income you’re receiving, and the site will calculate what your future income would need to be at some point in the future, just to maintain your current lifestyle.

Let’s say you’re 65 today, receiving $100,000 a year from an annuity.  How much of your future lifestyle will that annuity pay you when you’re 90?

Assuming an inflation rate of 3% a year, you would need $209,378 in that year you turn 90 to afford the same things you do today.  So your other investments would have to contribute more, in that year, than what the annuity was paying you.  Put another way, the annuity would be paying less than half of what you need to maintain your current expenses into the later years of your retirement.  If inflation were to average 4%, the future income needed to match today’s $100,000 rises to $266,584.

This is not an argument that annuities are to be avoided in all cases; a guaranteed lifetime income may have its place in some financial plans.  But a few inputs into this calculator can go a long way toward making the case that investments that grow over time are vitally necessary to afford a comfortable future retirement.  The safety of a guaranteed fixed income is a false promise, because it doesn’t protect you against the near-certain, incremental danger of yearly inflation.

Contributed by Bob Veres

Posted in Uncategorized | Leave a comment

Bank of Japan’s 75% ownership of ETFs and rising


False Positive?

We’ve all heard about as much as we can take about the U.S. Fed’s multi-part QE program, and similar stimulus programs instituted by the European Central Bank.  What they mostly have in common is the purchase of government and certain mortgage-backed bonds on the world markets, which has the effect of holding down bond rates and, therefore, borrowing rates.

But surely the strangest form of government intervention is taking place in Japan, where the Bank of Japan has embarked on an aggressive program of buying, not just  Japanese government bonds, but also stocks.  Having a buyer the size of Godzilla stomping into the equities market is bound to add to the demand side of the market, which will tend to raise stock prices—and, indeed, the Japanese Topix Index—the broadest measure of Japanese stocks—has risen from 1500 in May to 1813 recently.  The year-to-date return is a robust 19.78%.

But the question is: how long can the Bank of Japan keep adding to its stock portfolio?  A recent report shows that the Bank of Japan now owns 75% of the shares of Japanese ETFs (see chart), and some predict that it will own 80% by year-end.

The Bank of Japan’s aggressive buying up of Japanese government bonds has led to one of the more interesting anomalies in the global financial scene: bonds are now routinely issued at negative interest rates, meaning the Bank of Japan and other buyers are guaranteed to lose money when they buy the bonds.  In the stock market, the situation may not yet be quite as disruptive, since Japanese ETFs are not as dominant as they are in the U.S.; the Bank of Japan holdings currently amount to just over 5% of Japan’s Topix index stock market capitalization.  But nobody knows what will happen when (and it is not “if” but “when”) the central bank has to start selling off its positions.  The bull market that Japanese investors have enjoyed this year may not be sustainable on the metric merits, and could turn around fast if Godzilla decides to stomp in the opposite direction.

Source:

http://www.zerohedge.com/news/2017-09-11/wtf-chart-day-boj-now-owns-75-japanese-etfs

Contributed by Bob Veres

Posted in Uncategorized | Leave a comment